Volume Profile for NinjaTrader 8 Settings
Volume Profile Settings
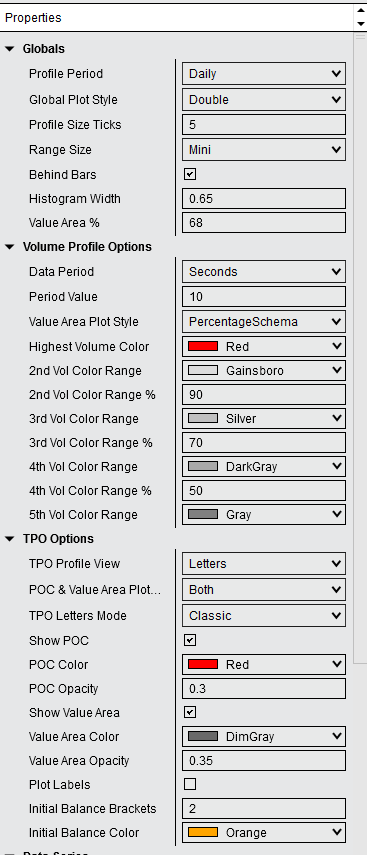
Data Period - this is the underlying data series which will be used for calculations of the volume profile. Please make sure this data is available! Otherwise you will not see any plots. Ticks would be the most time and resource consuming but at the same time is the most accurate.
Period Value - this is used to specify a value for the data period type selected in the prior setting.
Value Area Plot Style - this is used to specify how the value area will be plotted on the volume profile.
If Same as TPO is selected the same classical algorithm a used on the TPO will be used to calculate the value area. You can find more information about the calculation here https://www.mypivots.com/dictionary/definition/40/calculating-market-profile-value-area
If Percentage Schema is selected then you have the option to break the profile into % zones with the most volume ie. most volume bar, down to 90% of the volume, down to 70%, down to 50% and below 50%. The percentages are variable so you can choose the number and plot color that you prefer.
Created with the Personal Edition of HelpNDoc: Full-featured EBook editor