Global Settings Volume Profile TPO
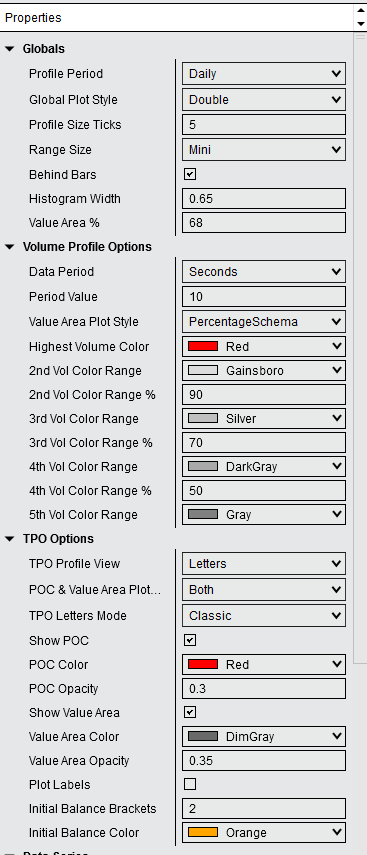
Profile Period - sets how often you want the profile to be plotted. Four hour, daily, weekly, monthly and yearly options are available.
Global Plot Style - you have the option to display volume profile and tpo on the same period. For example for profile period of 1 day you can view volume and TPO at the same time. In this case you need to select double. If single is selected you will only see either TPO or Volume profile.
If single is selected you will see Calculation Type in the settings display were you will be able to choose between TPO and Volume.
If double is selected you will see setting for both available TPO and Volume. If single is selected you will only see settings for the profile you go with in the Calculation Type.
Profile Size Ticks - this refers to the TPO where the most accurate is 1 tick which means that to build the TPO each tick step in price is accounted for. If you decide to go with a larger number this means that some rounding will take place ie. the range of price from low to high inside the profile period will be subdivided into less increments If 1 tick is chosen the number of increments inside the range is simply the number of ticks.
Range Size - this is a very similar setting as Profile Size Ticks but is for the volume profile.
Behind Bars - plots the profile behind bars.
Histogram Width - this can be 100% maximum which means that the whole area inside profile period area will be used for plotting. Please note that if 100% is selected, you might not see the extension of the POC.
Value Area - this is used to specify the % for the TPO value area calculation
Created with the Personal Edition of HelpNDoc: Benefits of a Help Authoring Tool